2017-09-26
SVD-based visualisation and approximation for time series data in smart energy systems
Publication
Publication
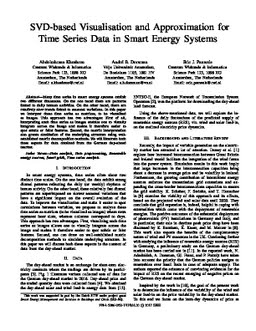
Many time series in smart energy systems exhibit two different timescales. On the one hand there are patterns linked to daily human activities. On the other hand, there are relatively slow trends linked to seasonal variations. In this paper we interpret these time series as matrices, to be visualized as images. This approach has two advantages: First of all, interpreting such time series as images enables one to visually integrate across the image and makes it therefore easier to spot subtle or faint features. Second, the matrix interpretation also grants elucidation of the underlying structure using well-established matrix decomposition methods. We will illustrate both these aspects for data obtained from the German day-ahead market.
| Additional Metadata | |
|---|---|
| , , , , | |
| doi.org/10.1109/ISGTEurope.2017.8260303 | |
| IEEE PES Conference on Innovative Smart Grid Technologies | |
| Organisation | Intelligent and autonomous systems |
|
Khoshrou, M., Dorsman, A., & Pauwels, E. (2017). SVD-based visualisation and approximation for time series data in smart energy systems. In 2017 IEEE PES Innovative Smart Grid Technologies Conference Europe, ISGT-Europe 2017 (pp. 1–6). doi:10.1109/ISGTEurope.2017.8260303 |
|