2014-03-01
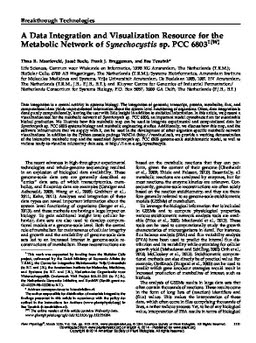
A Data Integration and Visualization Resource for the Metabolic Network of Synechocystis sp. PCC 6803
Publication
Publication
Plant Physiology , Volume 164 p. 1- 11
Data integration is a central activity in systems biology. The integration of genomic, transcript, protein, metabolite, flux, and computational data yields unprecedented information about the system level functioning of organisms. Often, data integration is done purely computationally, leaving the user with little insight besides statistical information. In this article, we present a visualization tool for the metabolic network of Synechocystis PCC6803, an important model cyanobacterium for sustainable biofuel production. We illustrate how this metabolic map can be used to integrate experimental and computational data for Synechocystis systems biology and metabolic engineering studies. Additionally, we discuss how this map, and the software infrastructure that we supply with it, can be used in the development of other organism-specific metabolic network visualizations. Besides a Python console package VoNDA (http://vonda.sf.net), we provide a working demonstration of the interactive metabolic map and the associated Synechocystis genome-scale stoichiometric model, as well as various ready-to-visualize microarray data sets, at http://f-a-m-e.org/synechocystis/.
| Additional Metadata | |
|---|---|
| , , , | |
| , | |
| American Society of Plant Biologists | |
| Plant Physiology | |
| Organisation | Evolutionary Intelligence |
|
Maarleveld, T., Boele, J., Bruggeman, F.& Teusink, B. (2014). A Data Integration and Visualization Resource for the Metabolic Network of Synechocystis sp. PCC 6803. Plant Physiology, 164, 1–11. |
|